
How We Started
Web Related Benchmarks
Web Server Latency
Web Server Capacity
CPU Usage
CPU Intensive Operation Rate
IO Benchmarks
Memory Benchmarks
General Workload Benchmarks
Final Rankings
In this article we will be looking at performance benchmarks from these four cloud providers and noting down each ranking placement for each benchmark as follows:
- 1st place gets 3 points;
- 2nd place gets 2 points;
- 3rd place gets 1 point;
- 4th place gets 0 points;
- Any ties for a place will each get the upper placement points.
By the end of this series of benchmark analysis, we should have a winner among the four that looks like having the best price to performance ratio.
Let’s get started, this is going to be a long list of tables!
How We Started
First, we picked some medium-tier, general-purpose VPS’s from each of the four cloud providers and left them with the normal storage (we did not change to premium storage or any other available option).
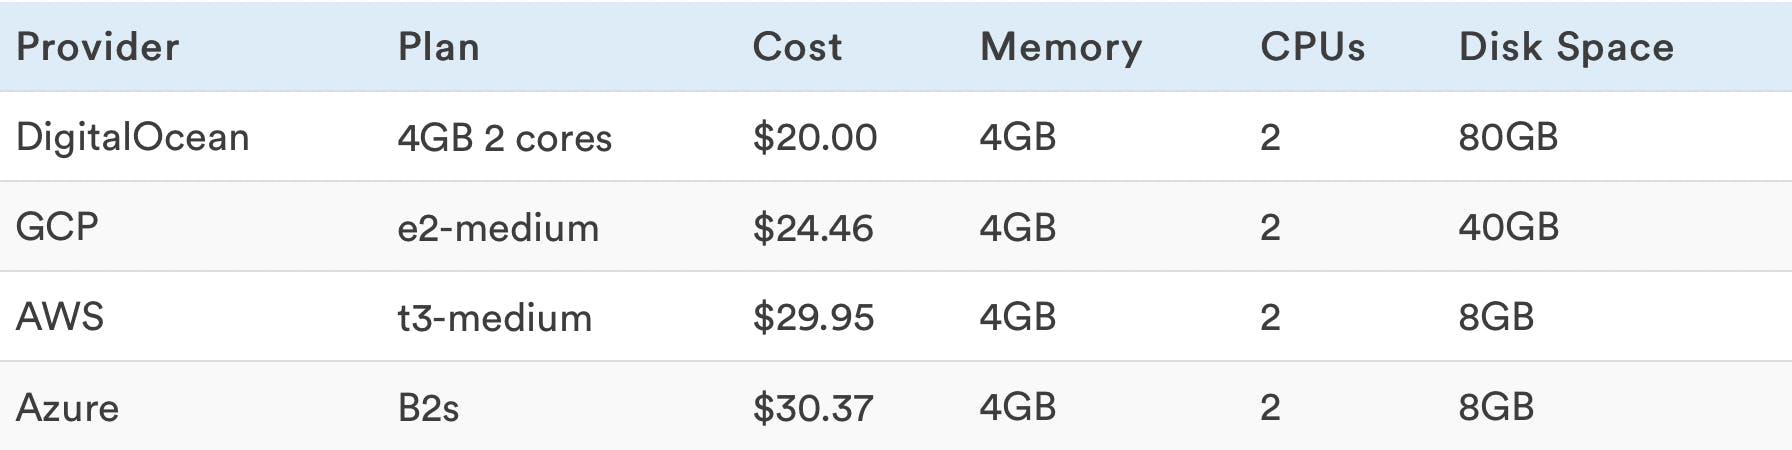
These VPS’s have the same memory and CPU specs, ignoring the discrepancies between the provided storage. Obviously, in this step, the price matters most in determining the winner.
Web Related Benchmarks
These benchmarks were made using Apache for serving requests and with PHP 7.1 installed running Magento Community Edition with a MySQL database process running on the server benchmarked. A basic monolith architecture. Network tests and other latency tests were made using another machine from the same provider and in the same region.
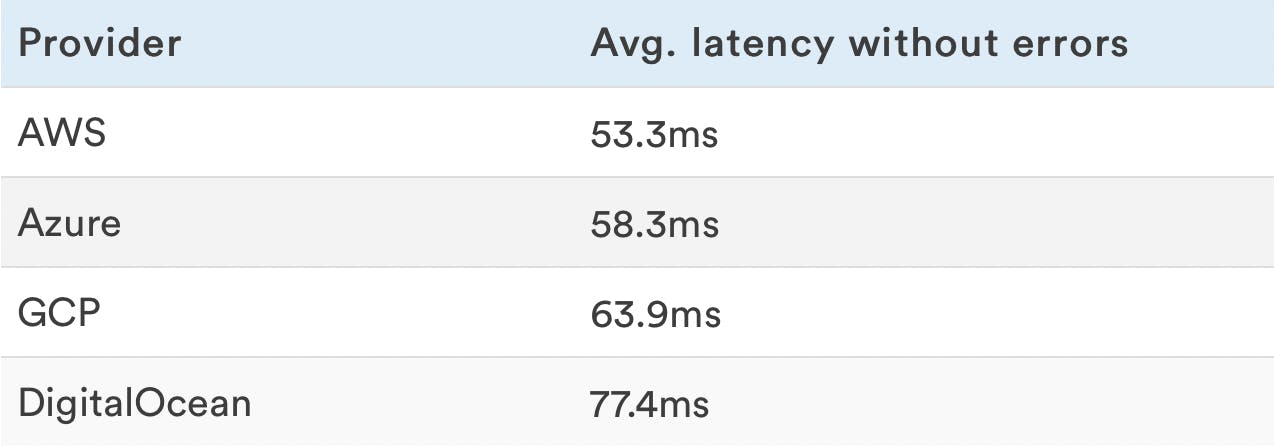
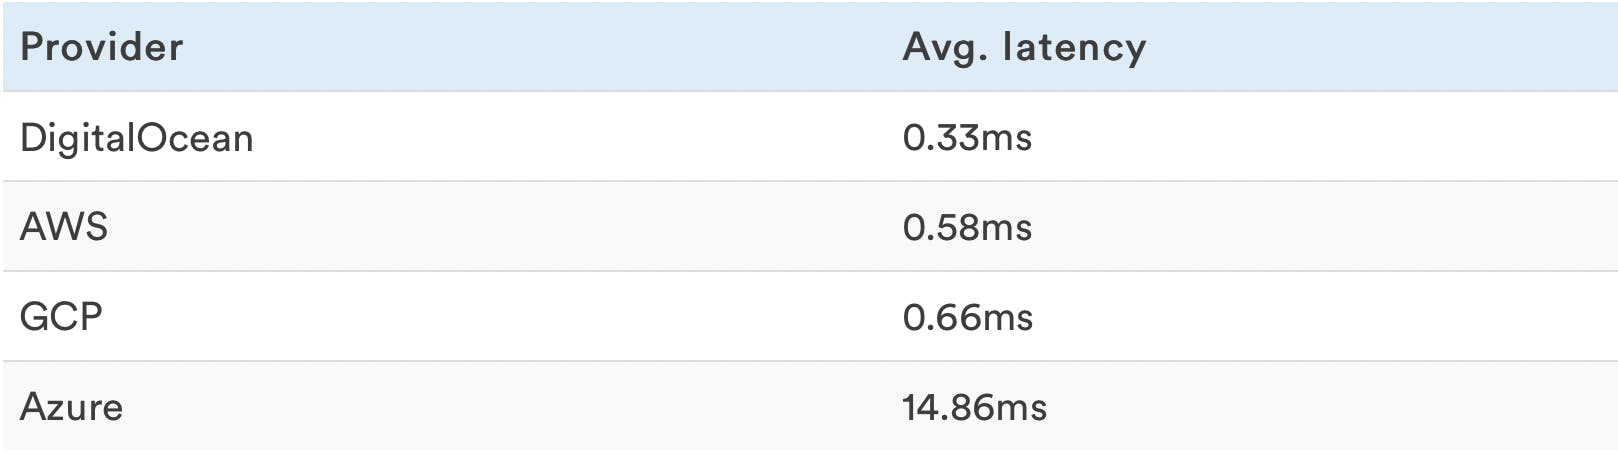
Web Server Latency
These are the webserver response times when it's operating under the max load level that doesn't cause it to return errors or time out.
Web server latency can be influenced by the VPS network speed, VPS storage read/write speed, CPU throttling, CPU steal, CPU operation limit, memory speed, memory capacity. More details in the benchmarks that follow.
A lower number means the VPS is faster.
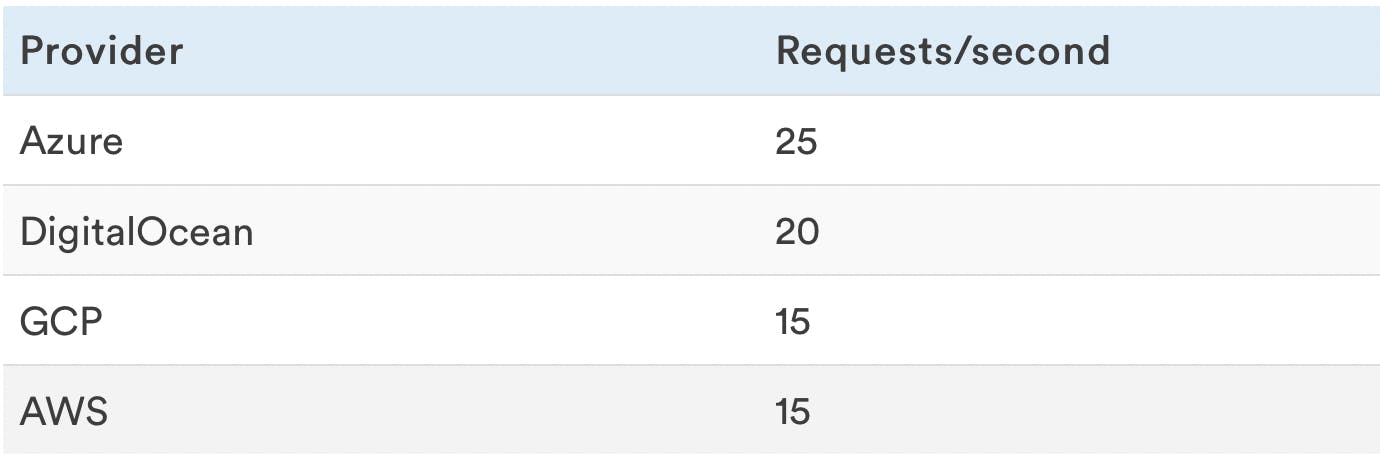
Web Server Capacity
This is the maximum number of requests per second that the web application can sustain without producing errors.
Web requests for testing were made using Apache AB.
A higher number means the VPS is faster and is still 100% reliable. The moment in which the VPS responds with errors its reliability percentage starts to go down.
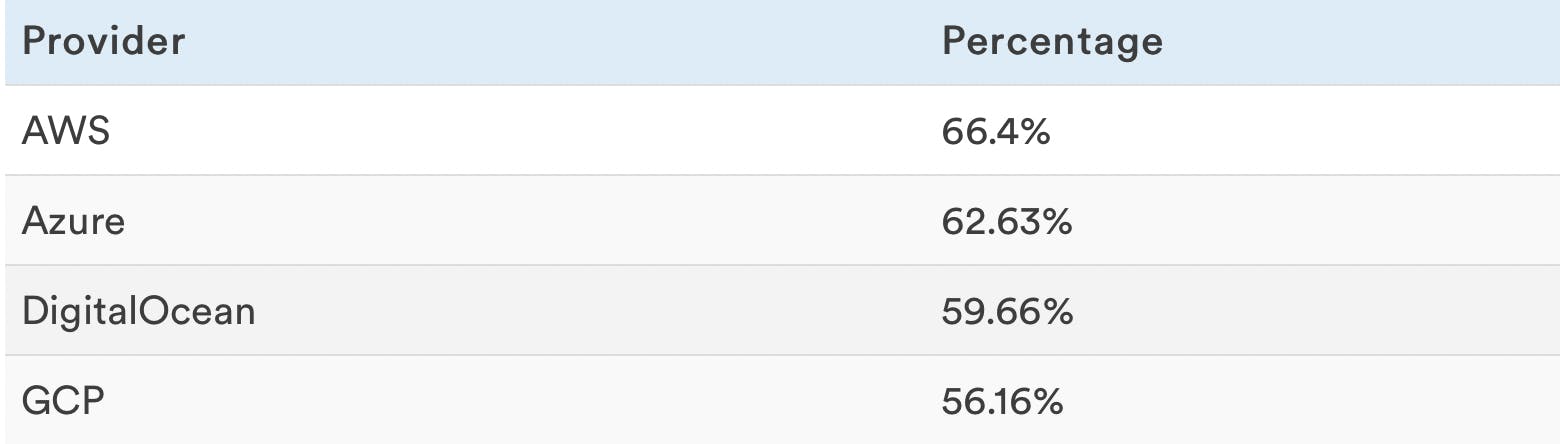
CPU Usage
This shows the CPU utilization of the VPS while the web application is serving 10 requests per second.
A higher CPU idle number means the VPS was consuming fewer resources to hold 10 clients per second successfully. Which would mean that the machine would have higher performance levels than the machines that had lower idle CPU percentages, translating in your server holding more users at the same time for example than the rest.
As far as web performance benchmarks go, that’s about it. Here are the rankings up until now:
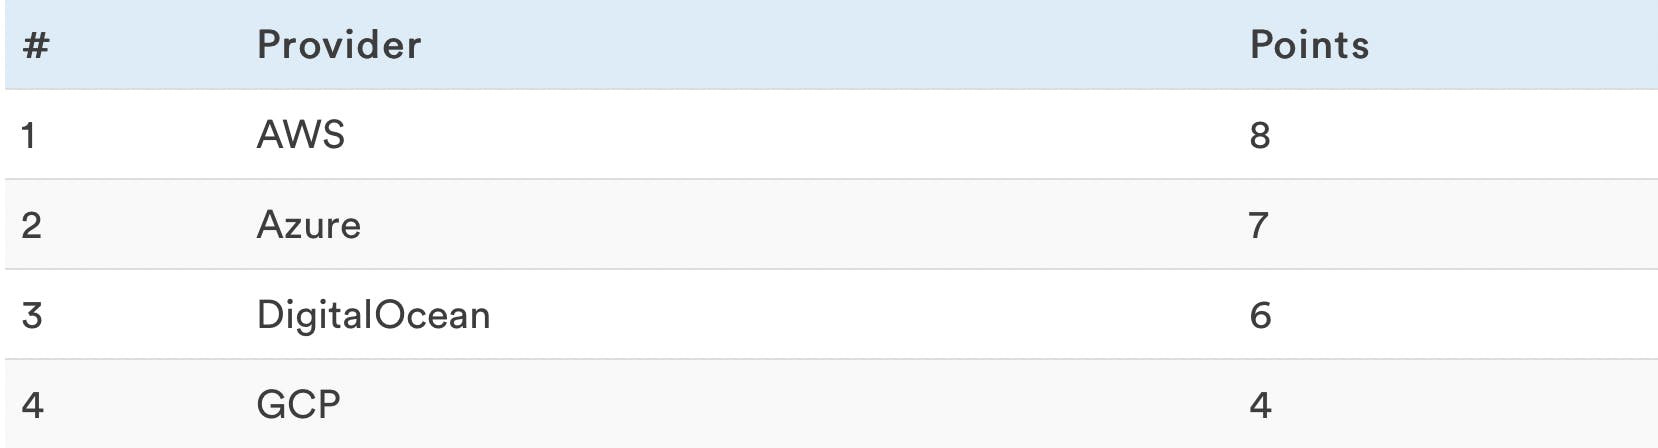
If you were tuned in just for some web performance benchmarks you can tune out here. Next, we will be getting into some more underlying benchmarks that will shake things up a bit.
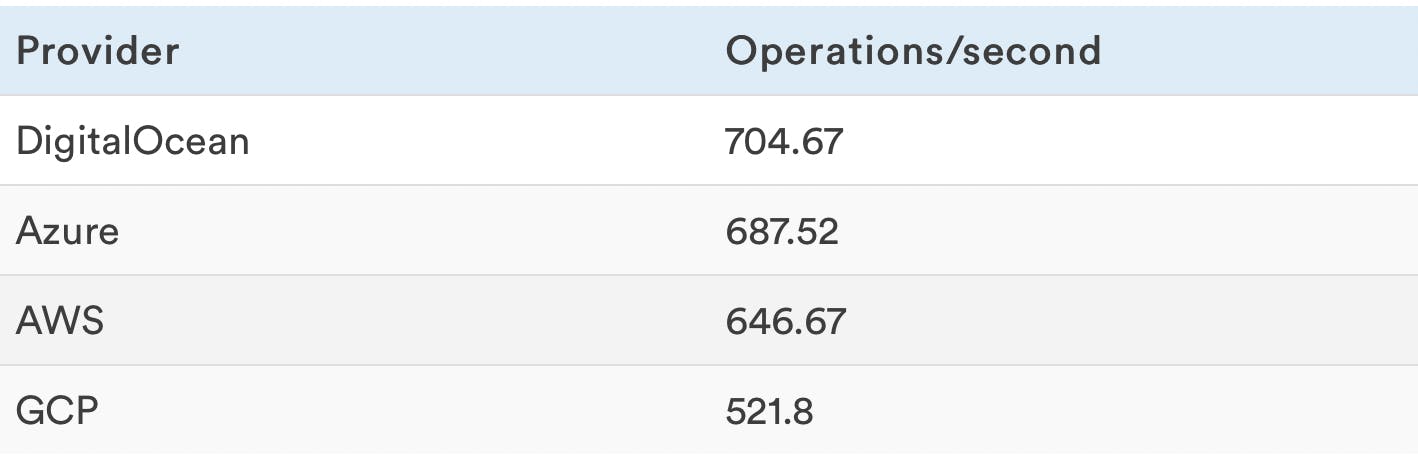
CPU Intensive Operation Rate
Higher is better. The underlying CPU’s ability to compute more operations per second ultimately impacts the speed at which it solves tasks, improving site speed and backend process speed.
IO Benchmarks
Test with various kinds of file I/O workloads.
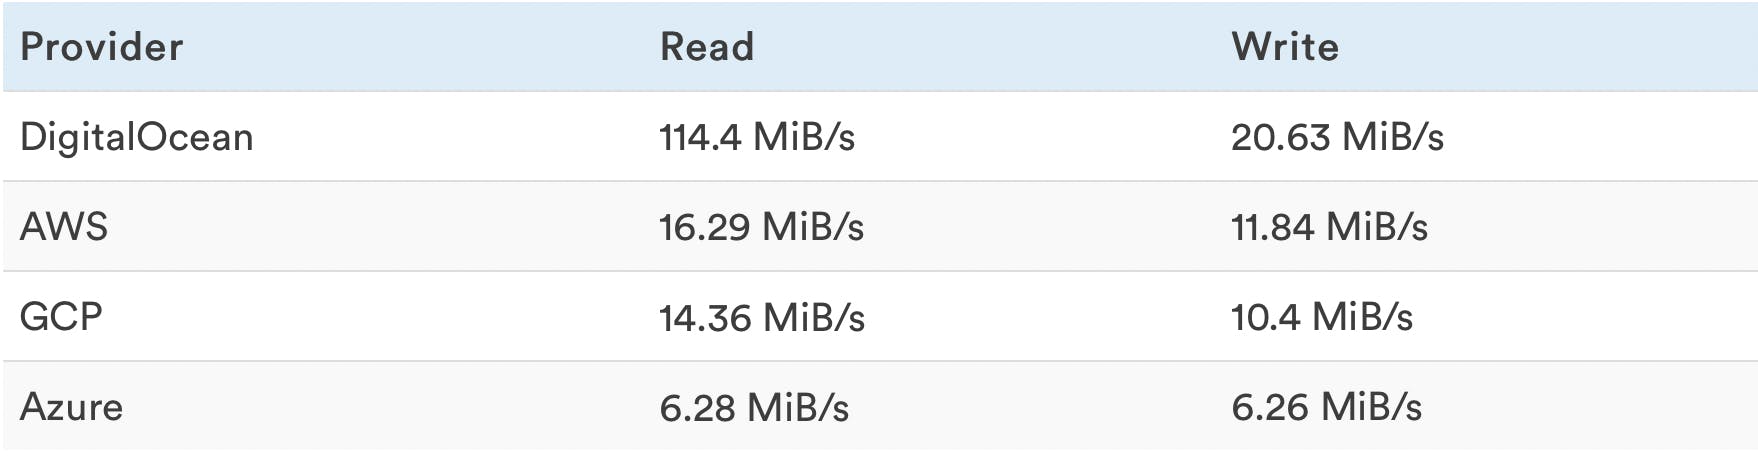
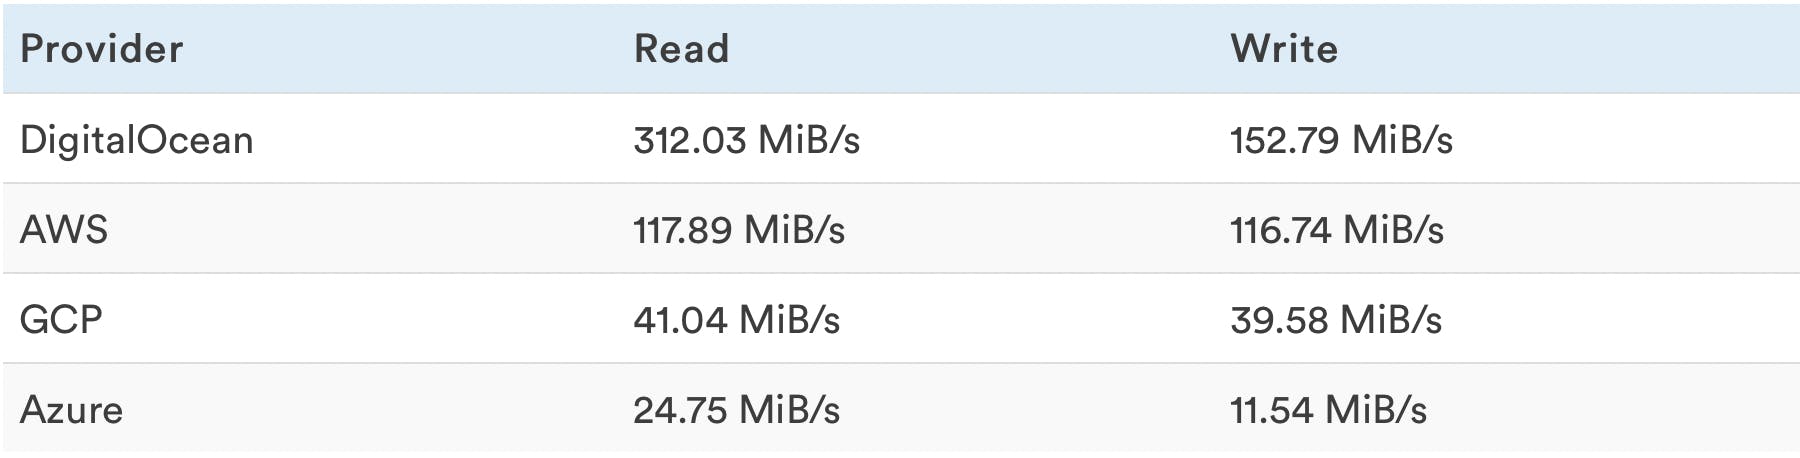
Random Read/Write Transfer Rates
Read and Write tests are performed separately.
Higher speeds are better because being able to read and write as fast as possible impacts general website performance.
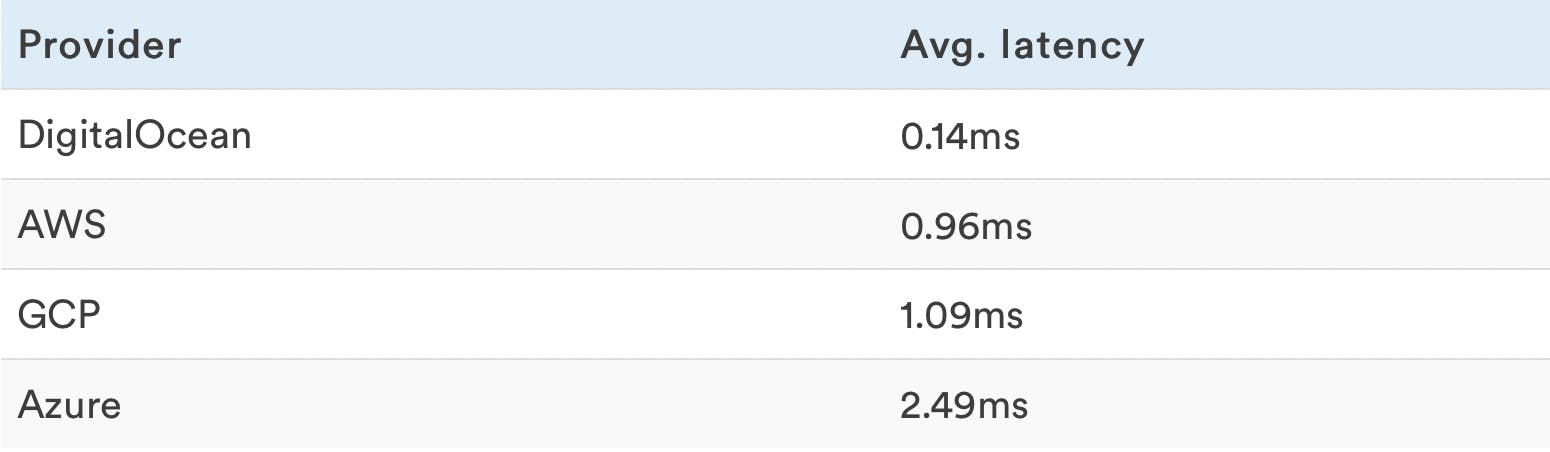
Random Read Latencies
Only reads were performed during this test.
Lower is better, being able to read with the smallest delay possible increases response times.
Random Write Latencies
Only writes were performed during this test.
Lower is better, being able to write with the smallest delay possible increases response times.
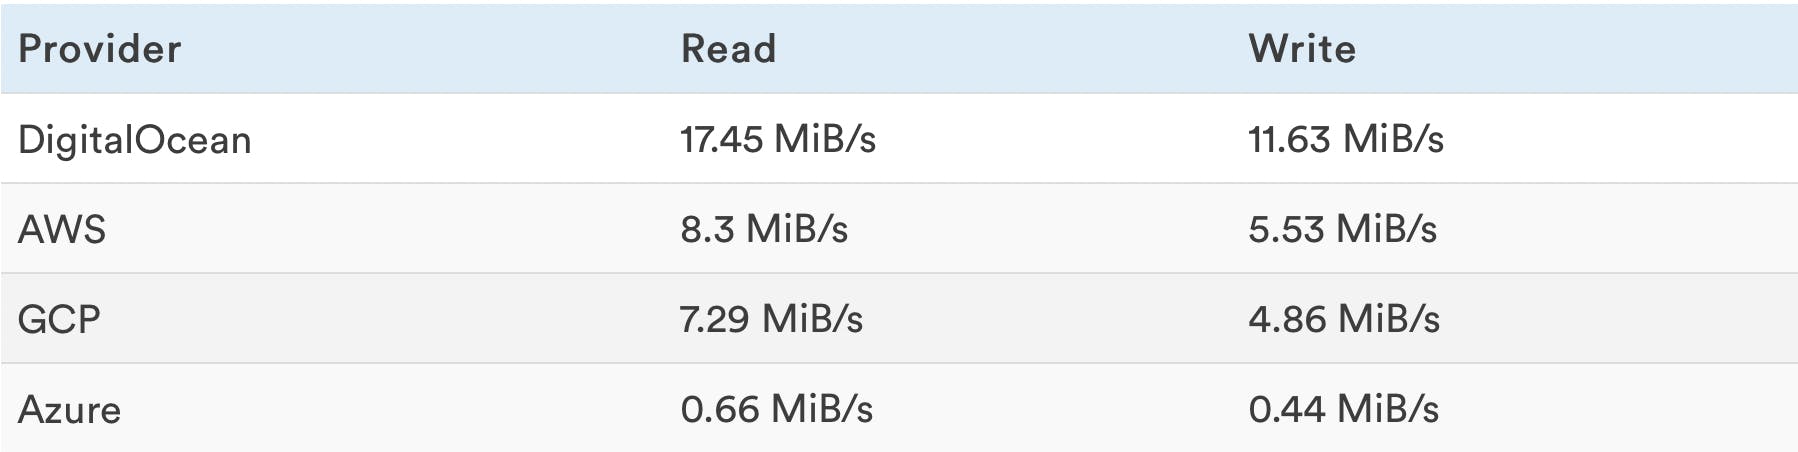
Random Read+Write Rates
This is a combined test where reads and writes are performed at the same time.
Higher is better. As opposed to the previous IO test that did read and write in two separate tests, this read and write test is executed in parallel, and as you can see the results show lower speeds.
Higher speeds are better because being able to read and write as fast as possible impacts general website performance.
Sequential Read/Write Rates
Read and Write tests are performed separately, each read and each write is executed in sequence not at the same time.
Higher speeds are better because being able to read and write as fast as possible impacts general website performance.
Memory Benchmarks
Memory allocation and transfer speed.
Memory Read/Write Rates
Read and Write tests are performed separately.
Higher is better.
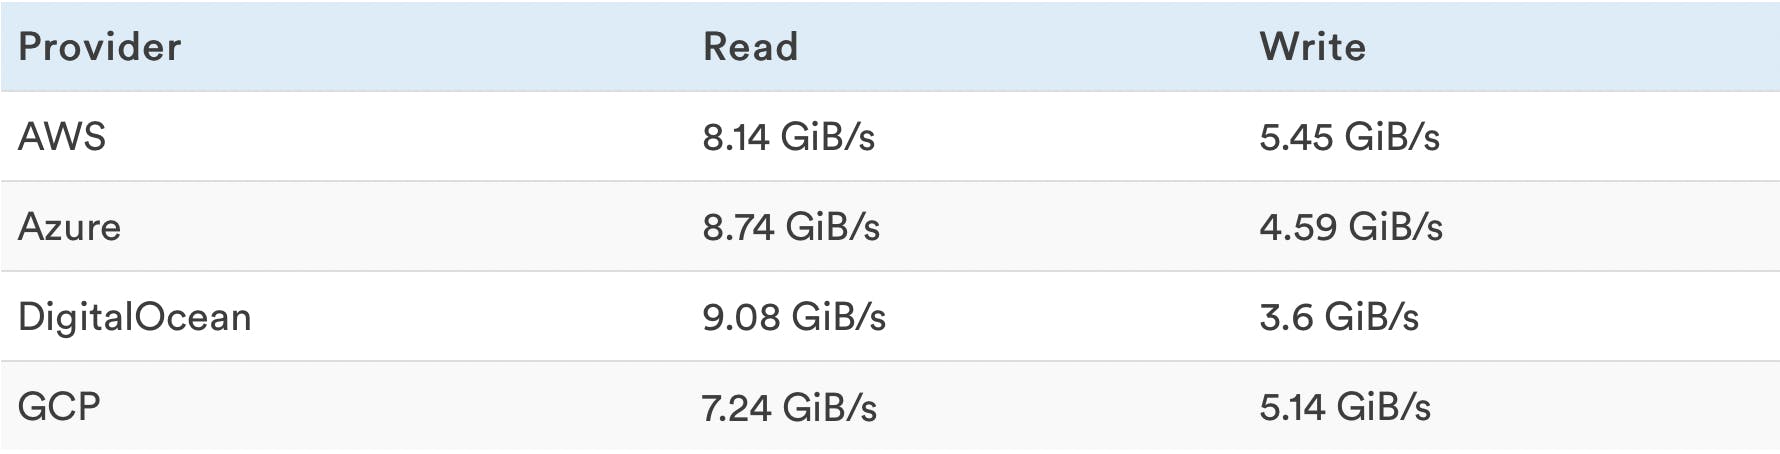
In this section, the winner has the best ratio of read vs write, not necessarily the biggest of both. The winner is AWS because it has the best mean value between the two.
General Workload Benchmarks
General benchmarks on tasks per hour, network speed, CPU steal, and coefficient of variation of number of tasks. CPU benchmarks were made usingsysbenchands-tuiwithstress.
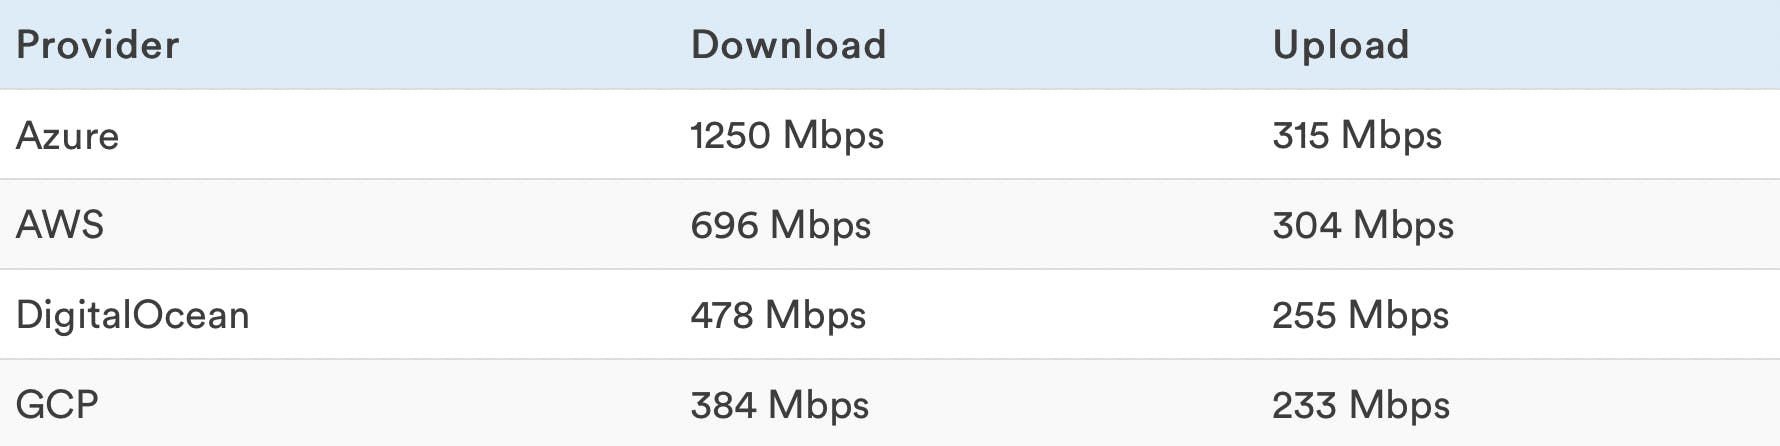
Network Speed
A higher number means the VPS is faster. These benchmarks were made using machines from the same provider and same region as the one being benchmarked.
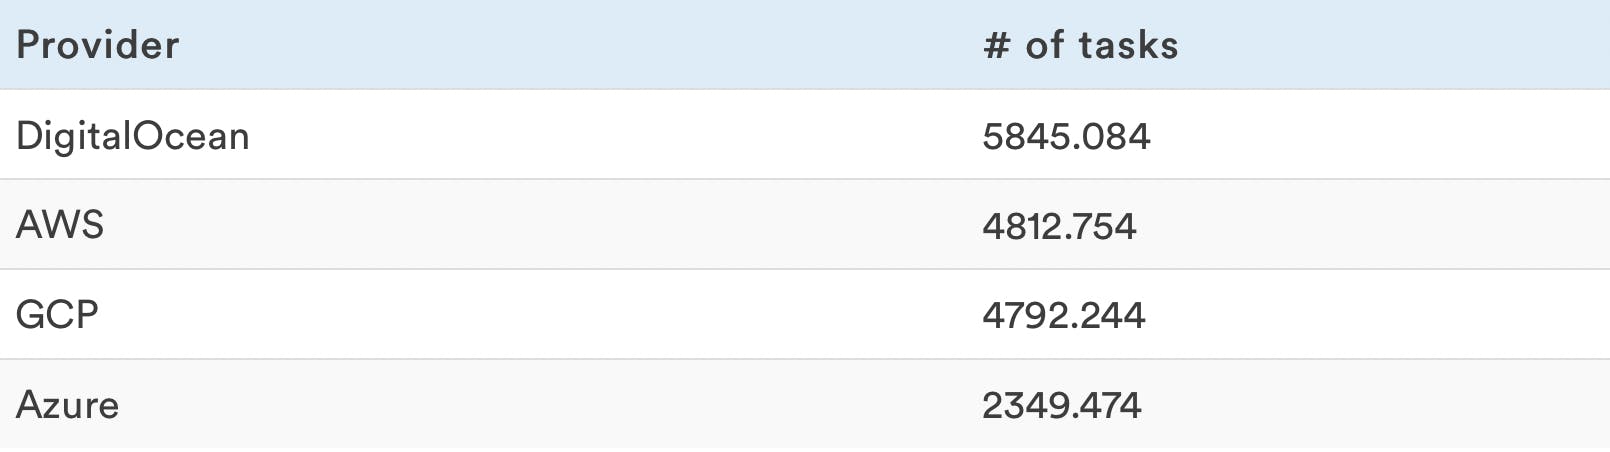
Number of tasks executed per hour
This is the average number of iterations the VPS executed every hour over 24 hours.
A higher number means the VPS is faster.
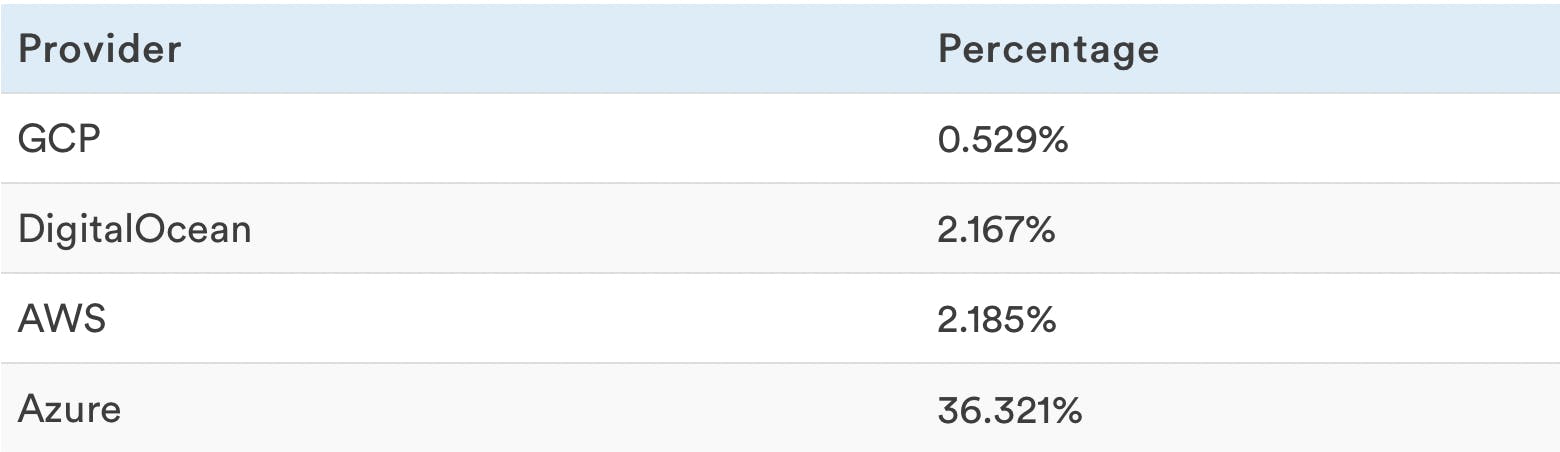
Coefficient of Variation of number of tasks per hour
The coefficient of variation represents the stability of the VPS performance throughout the test. It's the standard deviation divided by the mean number of iterations per hour.
A lower number indicates better stability.
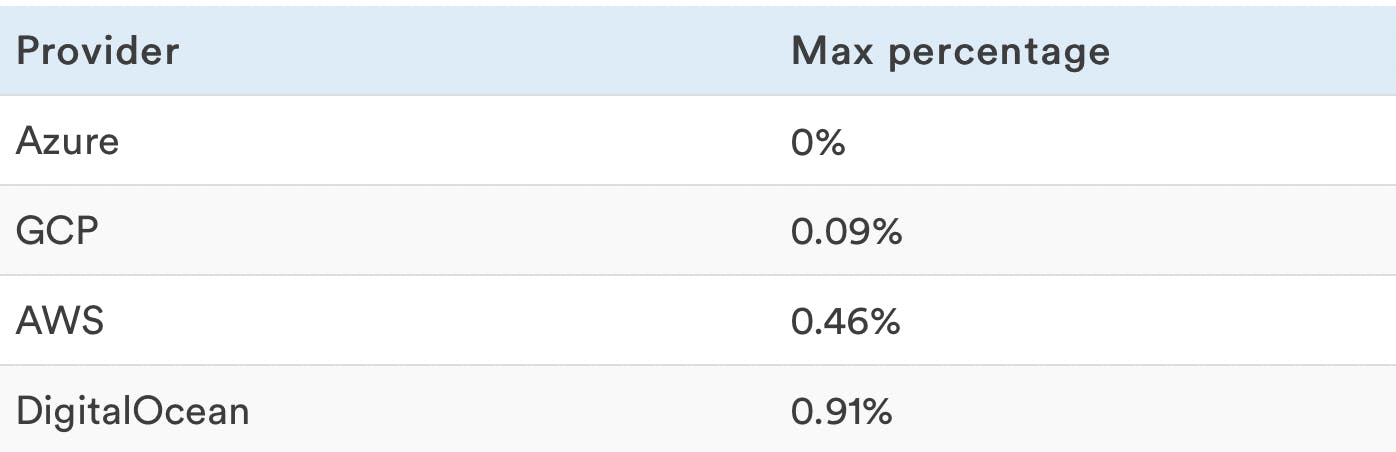
CPU Steal
This is the average proportion of CPU that is "stolen" by the hypervisor. A lower performance can often be explained by CPU steal running over 1%.
A higher number means the VPS host may be overallocated.
Final Rankings
After counting all the points this is the final outcome of our analysis, based on what you get for what you pay, some of the results were close enough not to actually differentiate between competitors but a ranking is a ranking, and even ½ a byte counts!
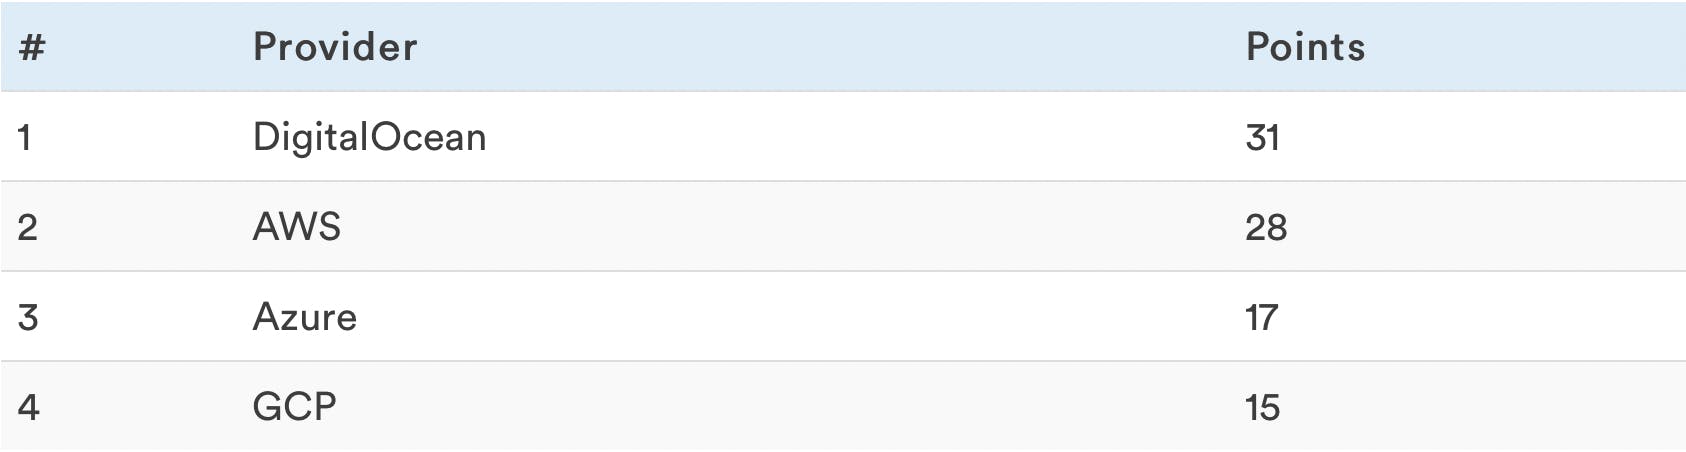
*These scores are just based on standings in the individual benchmarks, synergies were not taken into consideration.
That’s it - DigitalOcean is the overall best cloud service provider in terms of VPS performance when compared to AWS, Azure, and Google’s Cloud Platform. However, each of the tables above shows a different metric that may be more important to some users.
For example, even though GCP ranked last if you’re looking for stability while performing lots of tasks, it’s your best bet. The gist of it is: everyone needs something specific from their VPS, so you need to weigh all the pros and cons. Which of these will you go for?